


Water age is an important performance indicator to many utilities because excessive age can cause problems with disinfection by-products (DBPs).
The water age refers to the time it takes for water to travel from a water source to consumers and is influenced by water distribution system flow velocities and pipe lengths.
What happens if treated water doesn’t reach consumers quickly?
Water age is a general indicator of water quality, with lower water age indicating better water quality. If treated water stays in a system a long time before it reaches consumers, disinfectant concentration may not be strong enough to control microorganisms that can cause health problems.
Water often becomes stagnant or degrades in dead-end mains, which are often found in cul-de-sacs. Many water systems find it necessary to set up special programs to flush these dead-end mains periodically to maintain acceptable water quality (AWWA Opflow, June 2010).
So how do we determine how ‘old’ the water is?
Hydraulic modelling is the most straightforward way to determine water age conditions within the water supply area, including locations with high water age during standard operations as well as during maintenance.
Models can calculate water age for any operating condition, such as using various pump controls, installing new pipes, and closing valves. These ‘what if’ modelling scenarios allow maintenance and engineering personnel to evaluate consequences of shutdown on water quality and determine the most effective ways to reduce water age, without subjecting customers to methods that don’t work.
An easy way to model water age
A new web application in the market allows for water age modelling through predefined scenarios that are easy for maintenance and operation personnel to choose from.
The water age simulation results are statistically processed by the software, and layers with nodes and pipes colour-coded by the water age are presented in a practical and understandable manner.
There are two illustrations shown below, the first one is showing a layout of a physical system with cul-de-sacs, that is, a dead-end pipe loop where there is a risk of high water age when residents are not present, for example, during vacations. Below it is a computer simulation where the hydraulic and water quality conditions were analysed during one week and maximum water is statistically processed and displayed.
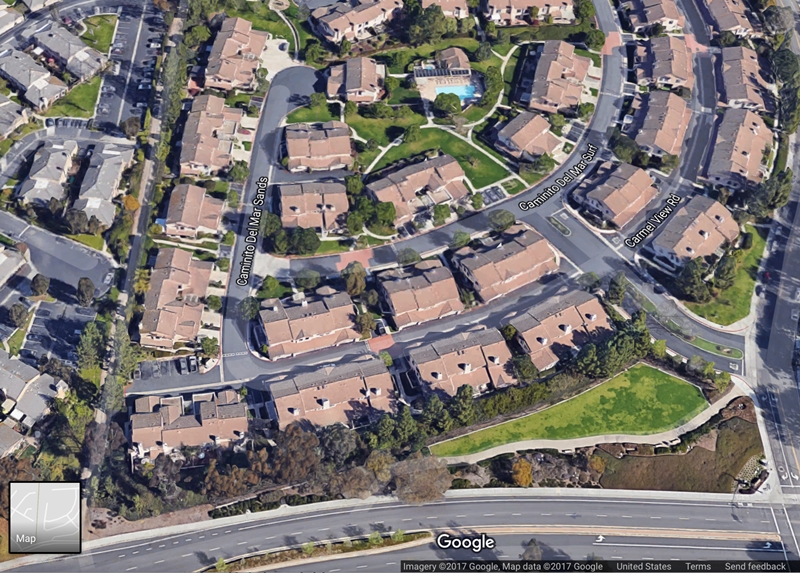
Google Map image of a neighbourhood with dead-end pipe loops. Imagery ©2017 Google. Map data ©2017 Google. Used with permission.
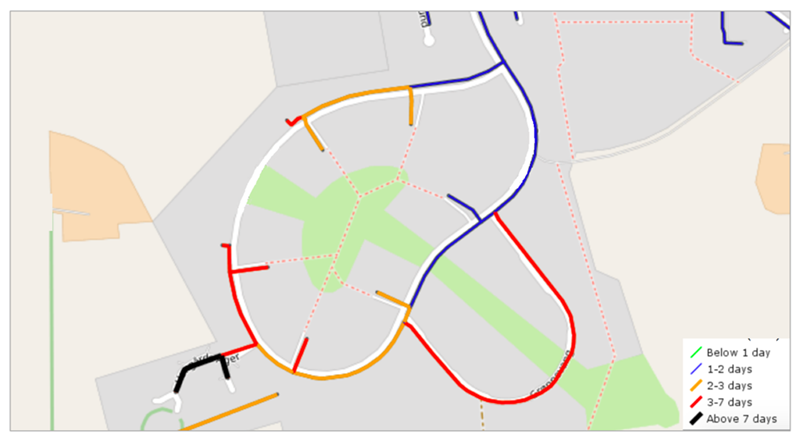
Water age simulation results where pipes with excessive water age are shown in red. © DHI
Curious to learn more?
Find out how you radically change the way you manage your daily water network operations. Read about the WaterNet Advisor.