PhD researcher Rahul Deopa and his supervisor Dr Mohit Mohanty discuss how integrated modelling can help cities assess flood hazards, water quality and human health risks together.
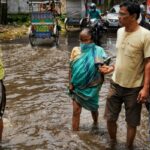
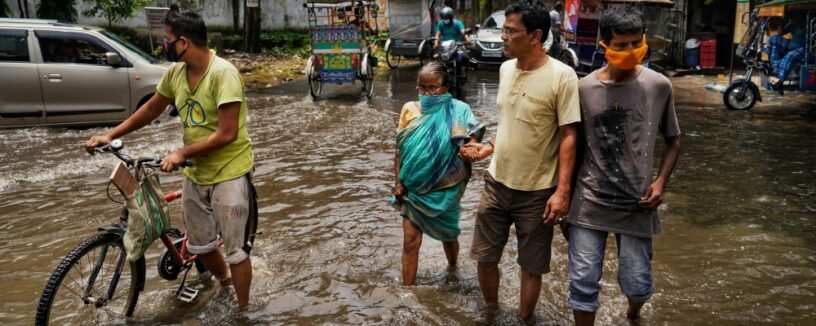
In many rapidly growing cities, floodwater can become a pathway for microbial contamination and public health risks. Yet flood hazards, water quality and human health impacts are often assessed separately, making it difficult to understand the full extent of risk.
As part of his PhD research at the Indian Institute of Technology Roorkee, Rahul Deopa, under the guidance of Dr Mohanty, developed an integrated modelling framework using MIKE+ and MIKE ECO Lab, with technical support from DHI. The resulting work, published in the Journal of Hydrology, combined flood modelling, water quality simulation, remote sensing and machine learning to examine the links between urban flooding, microbial contamination and public health risks.
Applied to the 2023 Delhi flood, the study found that 63% of the modelled floodplain area fell within high to very high flood hazard zones, while elevated concentrations of E. coli were linked to significant infection risks for exposed communities. We spoke with Rahul and Dr Mohanty about the motivation behind the research, the integrated modelling approach and its implications for climate-resilient urban flood management.
Q: What motivated you to investigate the links between urban flooding, microbial contamination and public health risks?
The trigger was the July 2023 Delhi flood, when the Yamuna peaked at 208.66 m. The response during the event was focused largely on water levels: where the river was rising, which areas were inundated and where evacuation was required. However, much less attention was given to what the floodwater actually contained.
In Delhi, this is particularly important. Our study reach, from Wazirabad Barrage down to Okhla, is only 22 km – less than 2% of the Yamuna’s length – but 16 major drains discharge into it, and it carries roughly three-quarters of the river’s total pollution burden. When that river spills into the floodplain, people wade through it for days.
There is also a practical obstacle. Precisely when you most need to know how contaminated the water is, you cannot go and measure it. Flood-time sampling is hazardous, access is restricted and monitoring infrastructure is often disrupted. As a result, by the time reliable measurements become available, much of the exposure may already have occurred.
There is also a clear gap between the two disciplines involved. Hydrologists produce hazard maps. Public health researchers investigate outbreaks afterwards. Neither answers the question a city needs answered during the event: which neighbourhoods face a real infection risk, and how large is it?
Q: Your framework combines flood modelling, water quality simulation, remote sensing and machine learning. What advantages did this integrated approach provide?
The integration was not just a modelling choice; it was necessary to overcome the lack of reliable flood-time measurements.
Contamination is typically measured at only a few locations and at limited time intervals, whereas flooding spreads rapidly across large areas within in a few days. As a result, routine monitoring alone cannot capture what people are actually exposed to during a flood event. So each component of the framework exists to supply what the next one cannot measure: satellite imagery provides spatially continuous water-surface temperature, the temperature–contamination relationship extends sparse microbial observations across the river, the hydrodynamic model transports this contamination over the floodplain and QMRA finally converts exposure into infection probability for adults and children.
The advantage was not that we could compute more. It was that the coupling exposed something none of the components could see alone.
A flood model on its own would have flagged the deepest reach as the highest priority. It would have been wrong. Around two-thirds of the floodplain fell into the highest hazard classes by depth, but the deepest stretch was not the most contaminated. A shallower reach upstream, sitting near a major drain outfall, carried substantially higher bacterial concentrations.
A water-quality assessment on its own would have missed it too, because it would have told us the river is dirty without telling us where that water ends up, or who is standing in it.
That divergence between hydraulic severity and health risk is the actual result. It is also the thing a flood management expert currently has no way of seeing. Hazard maps are what they have and hazard maps point at the wrong place.
Q: Why did you choose MIKE+ and MIKE ECO Lab for this research, and how did they support your modelling approach?
Delhi’s flooding is not purely a river problem. The Yamuna rises, but the damage is amplified because the city’s drains cannot discharge into a swollen river and water backs up into the streets. Representing that requires the river, the overland floodplain and the drainage system to be solved together, in one system, at the same time step. MIKE+ does this natively: 1D river hydraulics, 2D overland flow, major and minor drains dynamically coupled within a single environment. Stitching separate models together would have introduced precisely the errors we were trying to quantify.
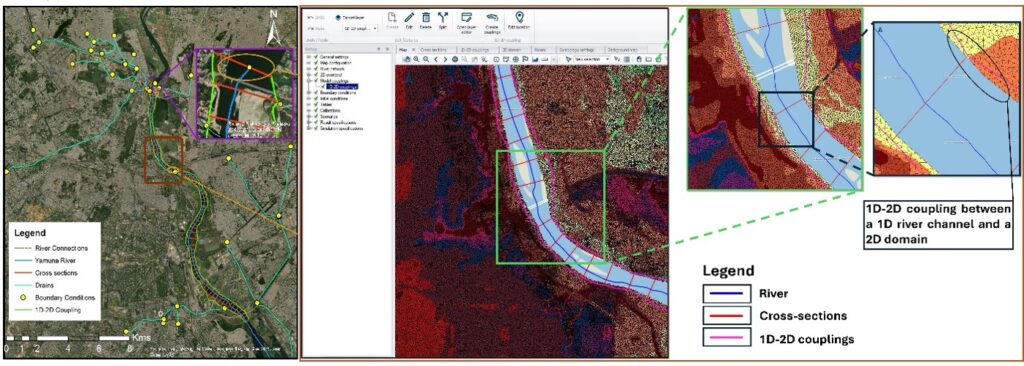
MIKE+ setup of the coupled 1D–2D hydrodynamic model for the Yamuna River, Delhi. Left: 1D river and drain network with surveyed cross-sections, boundary conditions and lateral couplings. Centre: MIKE+ model environment showing the flexible 2D mesh and active 1D–2D coupling layer. Right: Detailed view of lateral links enabling bidirectional flow exchange between the river and floodplain.
The flexible mesh mattered as well. We could refine resolution around embankments and drain outfalls – the features that control both where water goes and where contamination enters – without carrying that computational cost across the whole domain.
MIKE ECO Lab was the decisive component. It is an open ecological modelling engine that solves water quality processes concurrently with the hydrodynamics rather than after them. We used its Enterococci_Ecoli template to represent E. coli fate and transport, driven by different MIKE ECO Lab forcings. Because it runs on the same mesh and the same time step as the flow solution, water depth and active layer depth come directly from the hydrodynamic model. There is no offline coupling and no interpolating a concentration field onto a flood map after the fact.
That transparency is what made a genuinely coupled flood-to-health chain possible, rather than two analyses run side by side and compared at the end. DHI’s technical support during model set-up also helped us reach a working configuration considerably faster.
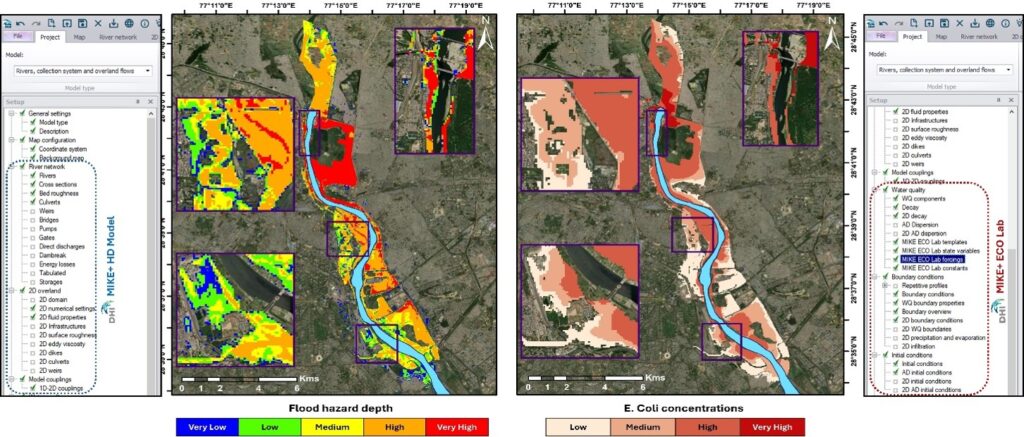
Simulated flood hazard and microbial conditions using the coupled MIKE+ Flood–ECO Lab framework. Left: Depth-based flood hazard from the 1D–2D hydrodynamic model. Right: Simulated E. coli concentrations (MPN/100 mL). The side panels show the corresponding MIKE+ hydrodynamic and MIKE ECO Lab model configurations.
Q: How can governments, utilities and city planners use this approach to strengthen flood resilience and protect public health in other flood-prone cities?
The framework is deliberately built from components most flood-prone cities can already assemble: terrain data, a drainage network, discharge records, land use and satellite imagery. The one genuinely new requirement is a modest water quality dataset at key outfalls to calibrate the microbial component. For a city that already maintains a flood model, this is an extension rather than a new programme.
Three practical uses are follows:
- First, warnings become risk-informed rather than depth-informed. A city can communicate not only where water will reach, but where contact with that water carries meaningful infection risk. That changes evacuation priorities, and it changes the advice given to people who cannot leave.
- Second, it shows where intervention actually pays. Because exposure can be traced back towards its sources, the model indicates whether health risk in a given neighbourhood is better reduced through floodplain works or by addressing an upstream outfall. Those are very different budgets and very different departments.
- Third, it informs planning. Floodplain regulation, siting of schools and health facilities, and upgrading of vulnerable settlements can all be prioritised on combined flood-health risk rather than hazard alone.
Two findings travel beyond Delhi. Children consistently faced higher infection probabilities than adults, which is a direct argument about where shelters go and who gets prioritised for clean water. And a conventional hazard map can misidentify exposure hotspots: the deepest reach in our study was not the most contaminated one. A city planning on depth alone risks directing its response to the wrong neighbourhoods.
As urban flood risks become increasingly complex, integrated approaches that connect hydrology, water quality and public health can help decision-makers better understand and manage risk. Rahul’s research demonstrates how combining advanced modelling, remote sensing and machine learning can support more resilient and informed planning in flood-prone cities.
Read the full study in the Journal of Hydrology: Coupled hydrological and public health risks from urban flooding: integrated remote sensing, machine learning, and hydrodynamic–ecological modelling
Learn more about the technology